· 2 min read
Realtime mode
Spark Performance Advisor can now report issues in the running apps

The original release of Spark Performance Advisor was primarily designed to show overall performance of your jobs over time. You could see, for example, that total execution time has increased last week, and from there, investigate which particular jobs are responsible, and why. That reflect the fact that originally, it was the tool for a platform team, and the big picture was all we needed.
Now let’s step in the shoes of an engineer who writes a new Apache Spark job. He wants to know if that one job has any performance problem. Ideally, he wants to be alerted about significant performance problems. Instead, he had to wait up to 24 hours, and drill down to the job.
Even for platform engineers, the trends view was often too high-level. Say, folks are reporting poor performance today. You need to look at the currently running jobs, and whatever issues they have, and it was not possible.
We’ve now added realtime mode, that shows all the jobs that are running now, and immediately shows any issues as soon as they are detected, even before the job has completed. Here’s now it looks
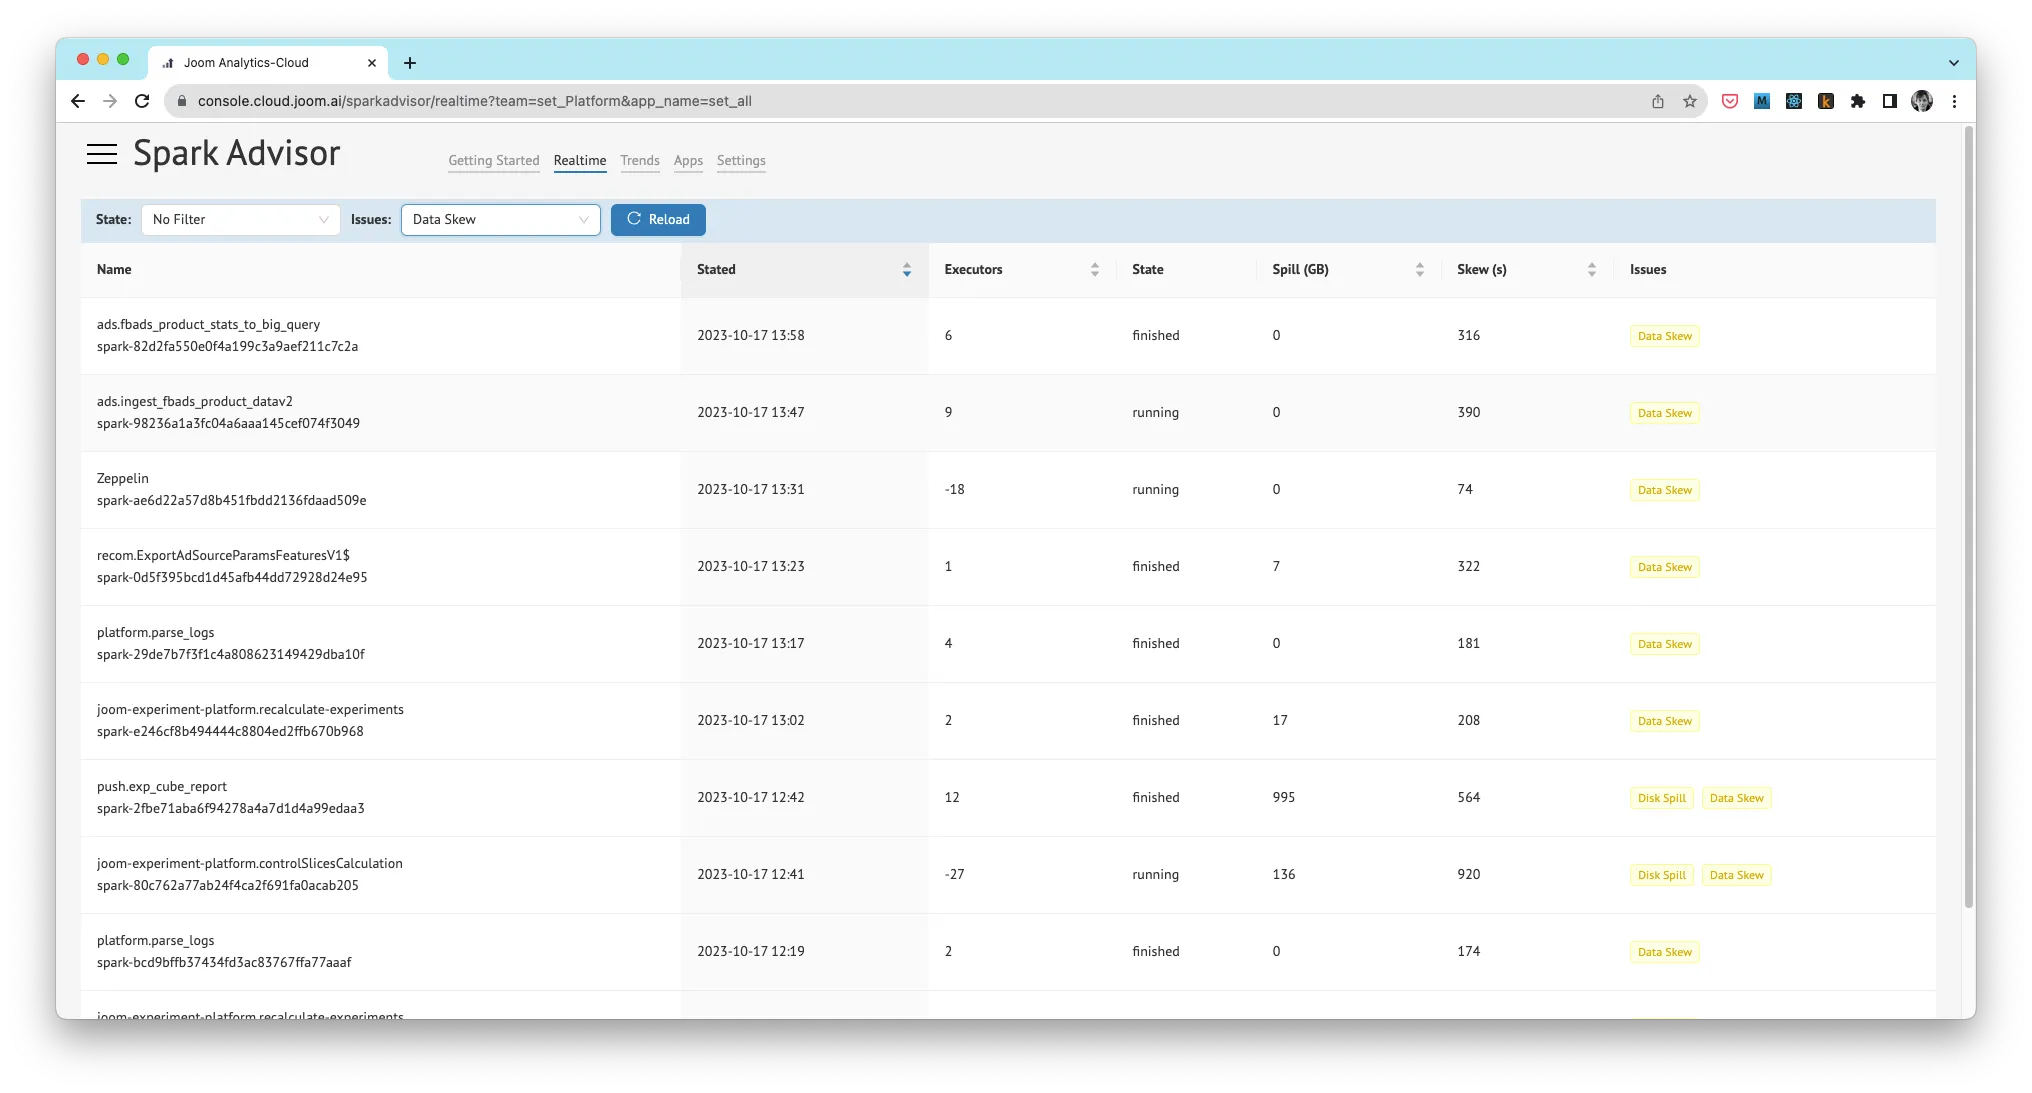
By default, it shows all the jobs started within last 24 hours, sorted by launch time. You can see if any issues are detected, and you can filter by a particular issue, or you can sort by issue severity - such as data spill.
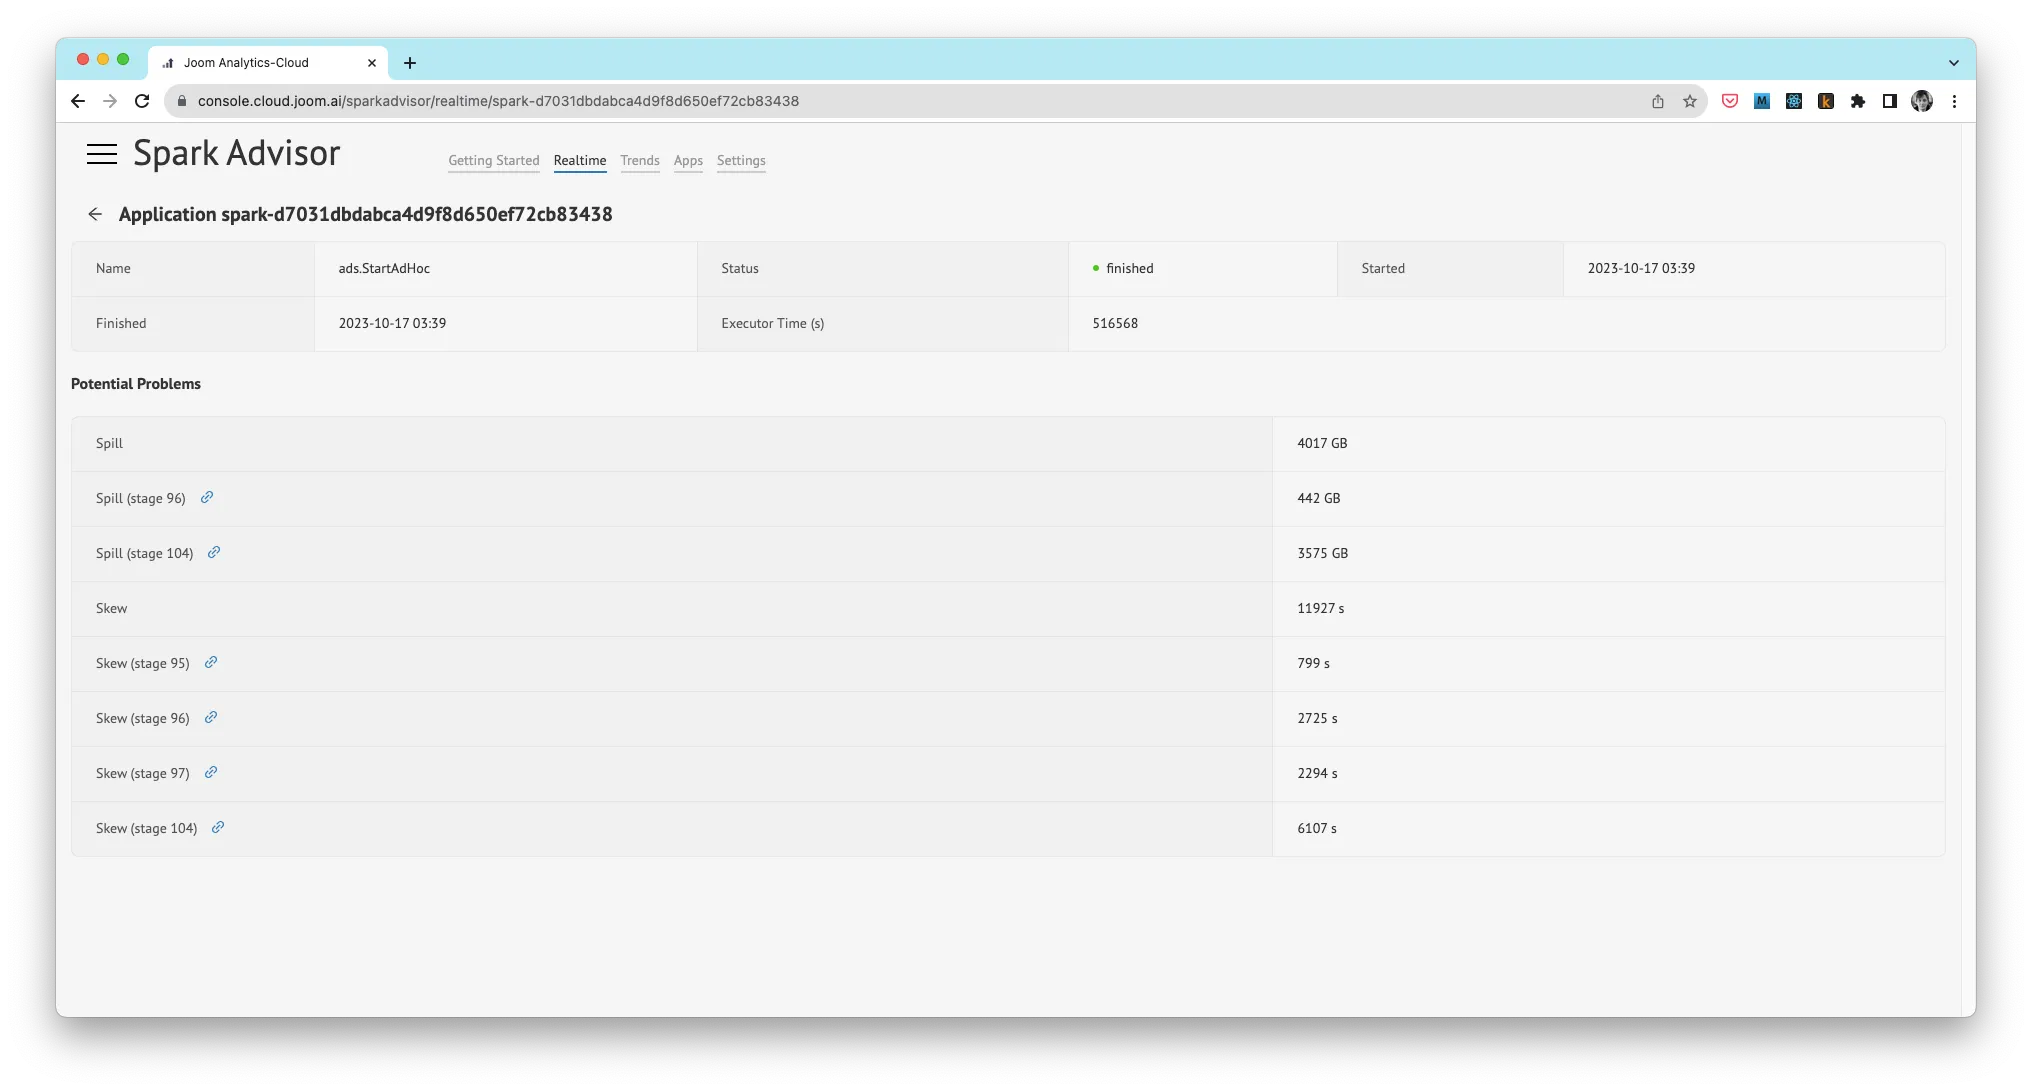
If you drill down into a specific job, there’s another very useful feature - per-stage reporting of issues. Specifically, if any stage has excessive spill or data skew, it is shown explicitly, and you can follow a link to your Spark History Server, to that specific stage, for further investigation.
These improvements have already helped us to find a few internal performance issues, and I hope they will be useful to you as well.