Spark Performance Advisor
Instant feedback on your Apache Spark jobs performance
As you run your jobs, we watch for common performance issues and provide recommendations on how to fix them.
Key Features
Detect common issues
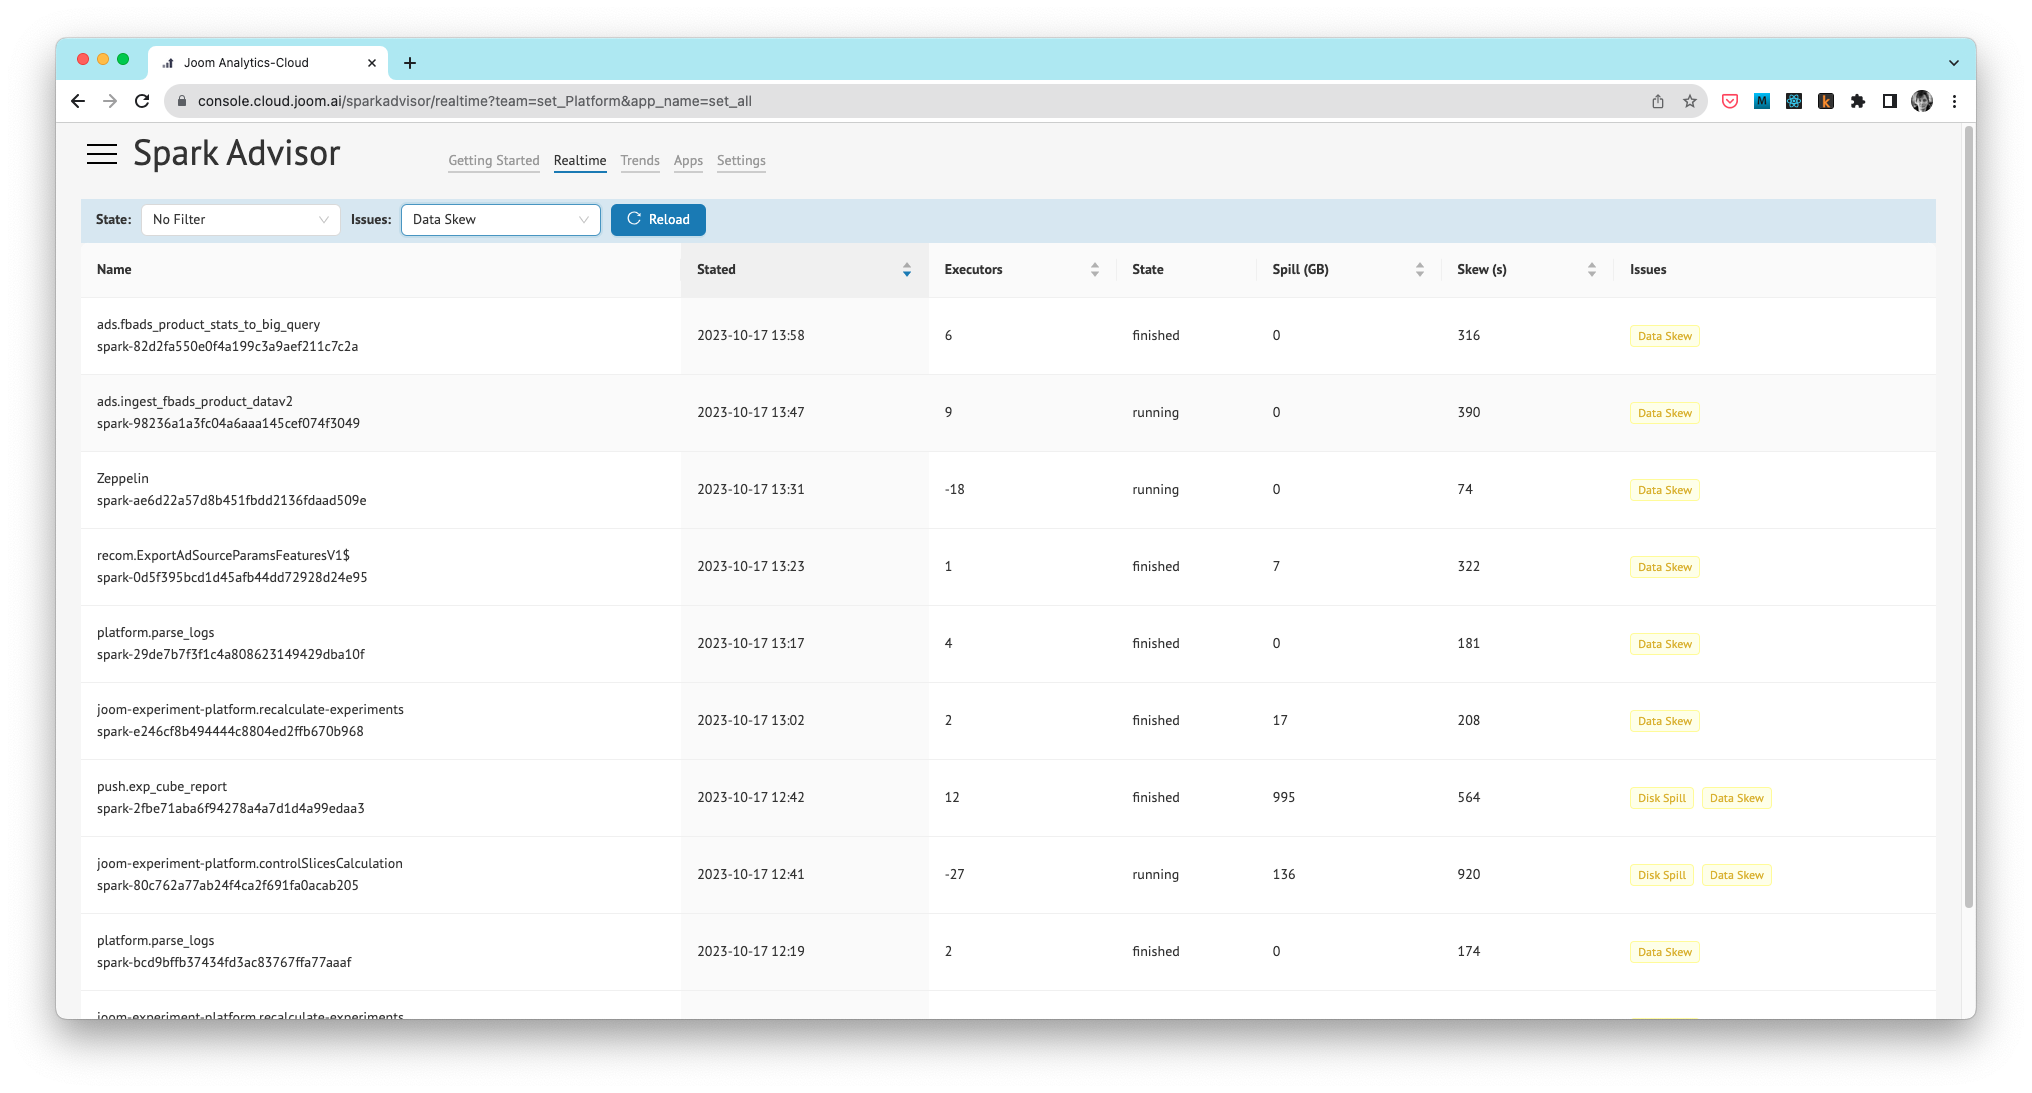
We detect data spill, excessive retries, unused executors, and of course our old friend data skew.
Real-time tracking
Most issues are detected immediately as job stages are executed.
Drill-down to stages
For problematic jobs, we show each stage with the problem, so you can efficiently understand the root cause
Track long-term trends
Got thousands of jobs? You can use Spark Advisor to automatically find performance regressions as data changes.
Frequently Asked Questions
Why use it?
Out of the box, Spark make it easier to shoot yourself in the foot, and then debug performance problems for a day. Spark Advisor can spot most issues immediately.
How does it work
We provide an open-source listener that you use in your Spark jobs. Telemetry is send to our API, where it is analyzed in real time, and aggregated to daily statistics.
What is the price?
Spark Performance Advisor is free. We expect that it will remain free for typical usage, but we reserve the right to introduce a fee for very heavy usage in future.
Is it safe sending our data to third party service?
Fair question, and that's why the listener is open-source - you can examine the data that is sent, and confirm that it is pure telemetry.
Can I install it on-premise?
In short, yes. However, you need to be comfortable with K8S and Helm charts, and the process is not as polished as we'd like, so we ask that you contact us directly.